


Nepal GDP explained in one line: gross domestic product is the total value of everything produced inside Nepal in a year — every bag of paddy harvested, every hotel room sold. In FY 2024/25, that total was about Rs 6.11 trillion, and the economy grew 4.61% in real terms, according to the National Statistics Office (NSO). The number makes headlines every spring, but it is easy to misread — so here is what it measures, how to read it, and what it misses.
Table of Contents
Nepal GDP explained: what the number actually measures
Nepal GDP explained at its simplest: GDP adds up the value of all finished goods and services produced within Nepal’s borders in a year — a sack of rice, a haircut, a new bridge. What is counted is production: not wealth, not happiness, and not money sent home from abroad.
Nepal’s NSO calculates GDP mainly from the production side: each sector’s value added, plus taxes on products minus subsidies. The same total can be reached by adding up everything spent or earned, but the headline comes from production. The NSO follows the System of National Accounts 2008 and publishes on a three-year cycle: preliminary for the current year, revised for the previous year, final for the year before that. The first number you hear is rarely the last.
Nepal GDP explained: nominal vs real — why growth is always “real”
Nepal GDP explained properly needs two versions of the number — confusing them is the most common mistake in reading it.
Nominal GDP is the total at today’s prices: Rs 6,107.2 billion in FY 2024/25, up from Rs 5,709.1 billion the year before — a rise of about 7.0%, part of which is just prices going up.
Real GDP strips out price changes, so it measures whether the country actually produced more — the figure behind the headline: 4.61% in FY 2024/25 at producers’ prices (3.99% at basic prices, which exclude taxes on products). “The economy grew 4.61%” means real GDP, not the rupee total.
Nepal GDP explained: the three sectors behind the total
Nepal’s economy is usually split into three sectors. In FY 2024/25, services made up 62.01% of GDP, agriculture 25.16% and industry 12.83% (NSO, via Nepal Rastra Bank).
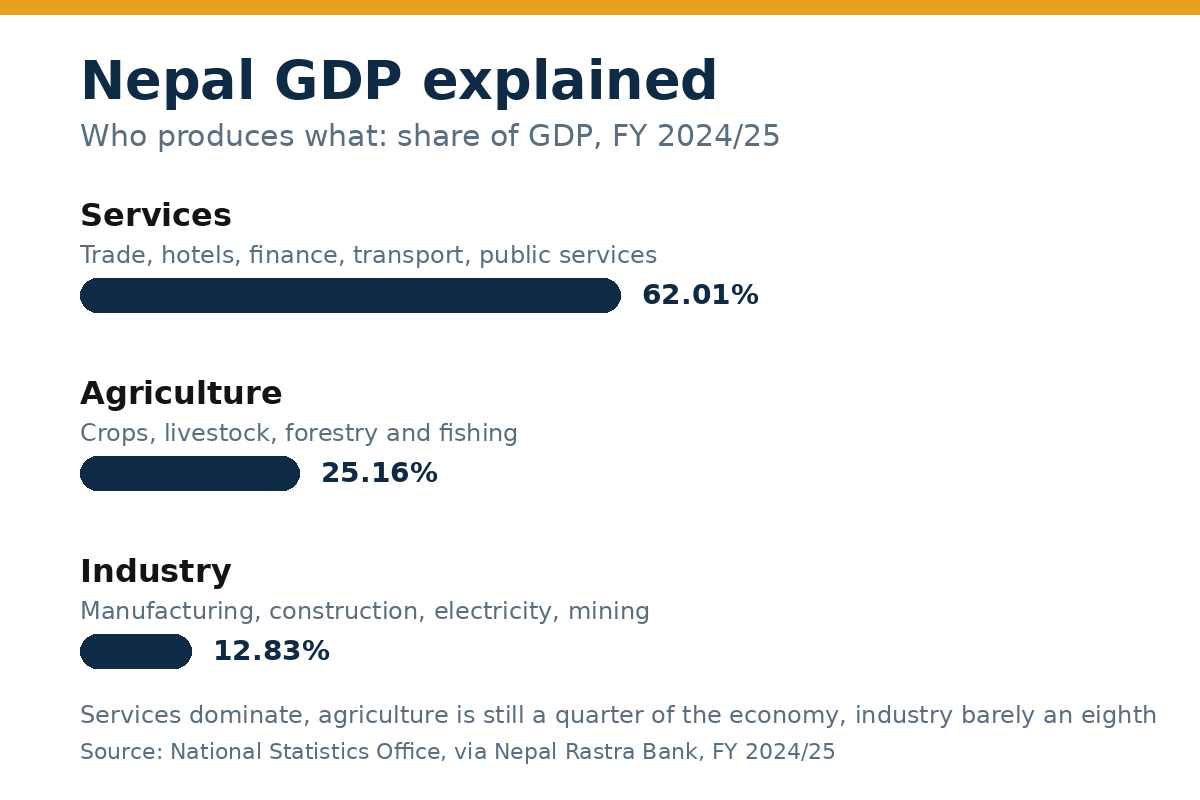
Services — trade, transport, hotels, finance, communications, education, health and public administration — is the biggest slice by far, growing 4.21% in FY 2024/25 on tourism’s recovery and remittance spending.
Agriculture still produces a quarter of everything — an unusually large share for a country at Nepal’s income level. It grew 3.28% in FY 2024/25, held back by dependence on the monsoon, small landholdings and low productivity.
Industry — manufacturing, construction, electricity and mining — is the smallest slice at 12.83%, and the one policymakers most want to grow. It grew 4.53% in FY 2024/25 — the fastest of the three — helped by hydropower and construction. With industry barely an eighth of the economy, Nepal imports most of what it consumes.
Nepal GDP explained: how to read a growth headline
Nepal GDP explained as a headline: a growth figure is a single number with a lot hidden inside it — five checks will keep you from being misled.
1. Ask which year, and which vintage. The NSO’s preliminary estimate for FY 2025/26 puts growth at 3.85%, with GDP at about Rs 6.60 trillion — and revised FY 2024/25 down to 4.43% from the 4.61% preliminary estimate. Both are official — the later one uses more complete data. Treat the first estimate as a draft.
| Fiscal year | Real GDP growth (purchasers’ prices) | Status |
|---|---|---|
| 2022/23 | 1.95% | Final |
| 2023/24 | 3.70% | Final |
| 2024/25 | 4.43% | Revised (preliminary estimate: 4.61%) |
| 2025/26 | 3.85% | Preliminary |
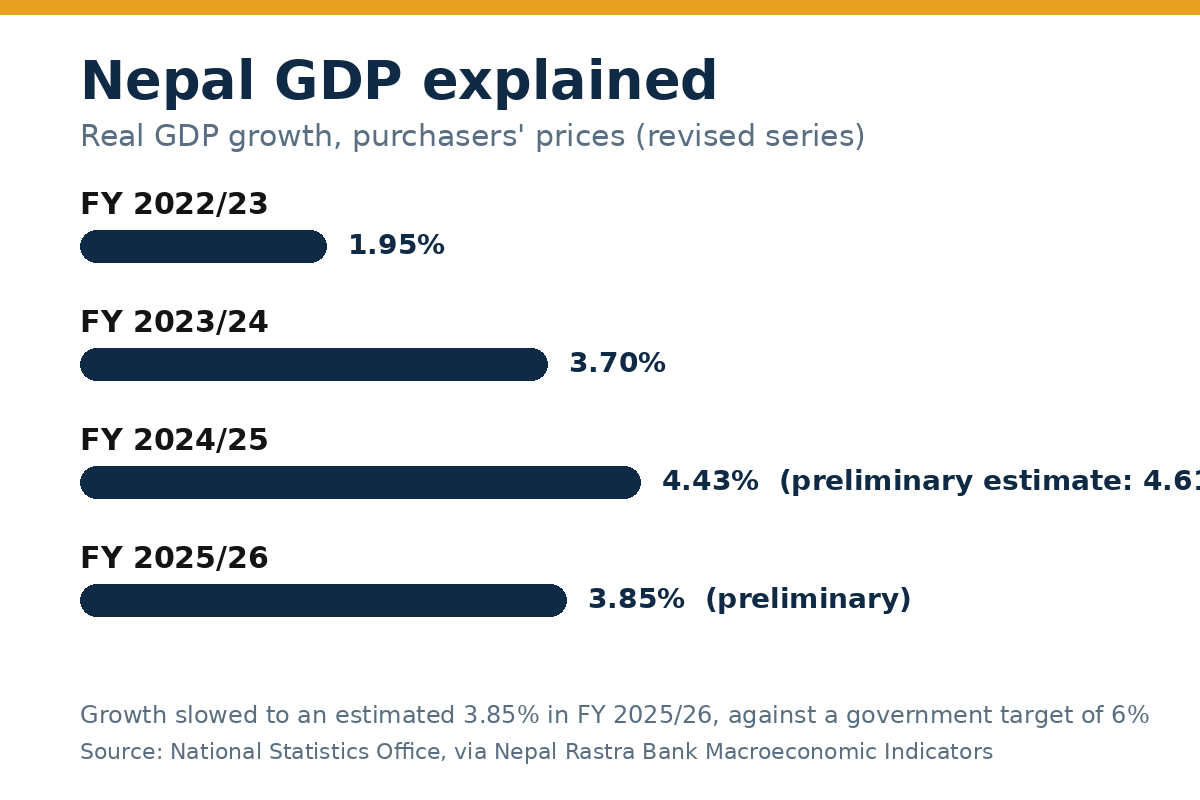
2. Compare with last year, not with the target. The government targeted 6% growth for FY 2025/26; the preliminary outturn of 3.85% missed it — but it is still growth, and higher than the 1.95% of FY 2022/23. A target is an ambition; last year is the honest comparison.
3. Check what drove it. Growth of 4.61% driven by services and a good harvest differs from the same number driven by a one-off construction boom — the sector breakdown above shows which it was.
4. Remember it is an average. National growth of 4% can hide one province at 6% and another at 1%: the NSO’s FY 2024/25 estimates put per capita GDP in Bagmati at USD 2,602, nearly three times Madhesh’s USD 932.
5. Do not expect precision. GDP is an estimate built from surveys, tax records and administrative data that arrive late and incomplete. A figure quoted to two decimal places looks exact; it is not — read the direction and the rough size.
Nepal GDP explained: what the number misses
Nepal GDP explained honestly has to include what the number misses: GDP measures production, and production is not the whole economy — let alone the whole of life. Four gaps matter most in Nepal.
The informal economy. Much of Nepal’s work happens outside formal records — street vendors, subsistence farming, daily-wage labour paid in cash. The NSO estimates some of it, but GDP almost certainly understates what Nepalis produce.
Unpaid work. Cooking, cleaning, childcare and caring for elderly relatives keep the economy running, but because no money changes hands GDP counts none of it — mostly women’s work, invisible in the headline.
Distribution. GDP per capita is an average: if one person earns Rs 10 lakh and nine earn Rs 1 lakh each, the average is nearly Rs 2 lakh — and it describes nobody. A rising GDP can coincide with most people feeling no better off.
Money from abroad. Remittance is not part of GDP: GDP counts what is produced inside Nepal, and money earned in Qatar or Malaysia was not produced here. But it is a huge part of what Nepalis can actually spend, which is why economists also watch gross national disposable income (GNDI), which adds remittance to what the country can spend. In FY 2024/25, GNDI was 129.69% of GDP: Nepal could spend nearly a third more than it produced, because of money sent home, while total consumption took 93.78% of GDP. Our explainer on remittance in Nepal looks at that flow — about 28% of GDP in FY 2024/25.
How GDP connects to the budget, debt and your life
Nepal GDP explained as a yardstick: it is the denominator for almost every other economic number you will read.
The federal budget for FY 2025/26 is Rs 1.964 trillion — roughly 30% of GDP, the yardstick for whether a spending share is big or small. Our plain-language guide to Nepal’s budget for 2026/27 breaks down where it goes.
Public debt is read the same way: Nepal’s outstanding public debt is about 44.6% of GDP. Debt on its own sounds alarming; as a share of the economy it tells you whether the country can carry it. Our piece on Nepal’s public debt explains that ratio.
GDP growth also shapes borrowing costs: strong growth lifts tax revenue so the government borrows less; slow growth squeezes the budget, and how Nepal Rastra Bank sets interest rates decides what your loan costs. None of this makes GDP a verdict on the country: it is a measuring tape — useful, standardised, and blind to everything it was not designed to measure. Read the number, then read what sits behind it.
Frequently asked questions
What is Nepal’s GDP?
Nepal GDP explained in numbers: about Rs 6.11 trillion in FY 2024/25 at current prices, and an estimated Rs 6.60 trillion in FY 2025/26 (NSO) — roughly USD 44 billion.
What is Nepal’s GDP growth rate?
Real GDP grew 4.61% in FY 2024/25 on the preliminary estimate (revised to 4.43%), and an estimated 3.85% in FY 2025/26 (NSO) — against a government target of 6%.
What is the difference between nominal and real GDP?
Nepal GDP explained simply: nominal GDP is production valued at current prices; real GDP removes the effect of rising prices, so it shows whether the country actually produced more. Growth rates are always quoted in real terms.
What is GDP per capita in Nepal?
Nepal GDP explained per person: about USD 1,496 in FY 2024/25 (NSO preliminary estimate) — an average hiding wide gaps, from USD 2,602 in Bagmati to USD 932 in Madhesh. Per capita gross national income, which adds money earned abroad, was USD 1,517.
Does GDP include remittance?
No — remittance is money earned abroad, and GDP only measures production inside Nepal. It does show up in gross national disposable income (GNDI) — 129.69% of GDP in FY 2024/25, the reason Nepalis can spend more than the country produces.